
 Capacity Planning Table
The planning table enables you to carry out detailed planning of capacity requirements continuously over time. Thus the system dispatches the requirements at specific points in time and in the sequence in which they are to be processed. They are dispatched to individual capacities (for example, machine groups, individual machines, individual people).
You can start the planning table from several R/3 applications (for example, production order, MPS planning, process planning). The data is formatted according to different views depending on requirements (for example, the capacity situation of a work center, the capacity situation of all the work centers involved with an order).
Layout of the capacity planning table
The capacity planning table consists of charts in which the available capacity (operating time) and the capacity requirements (operation duration) are grouped according to various criteria and displayed on the same axis. For example, all the capacity requirements for one order or all the capacity requirements that are dispatched to one capacity can be grouped together.
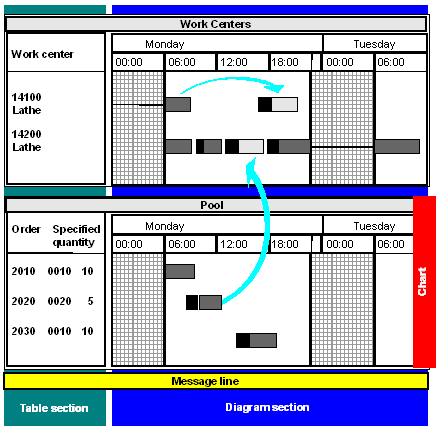
Each chart can have its own title bar and consists of a table section and a diagram section:
- The table section contains information for identifying and describing the objects displayed in the diagram section.
- The diagram section is a window on the virtual time axis in which the available capacity and the capacity requirements are displayed with their start and finish dates. This window displays the same segment for all the charts. You can change this segment as much as you wish by changing the scale.
You can display a time scale and the calendar for the object in the diagram section of every chart.
The following graphic shows the capacity planning table as a schematic display.
The following graphic shows the work centers with the operations dispatched to them in the upper chart. The operations (requirements) are displayed as bars; the setup times and processing times are distinguished using shading/highlighting in different colors. The shaded areas are break times saved in the shift sequence.
The lower chart contains the work list for the various orders and their operations, that is, the requirements that have not yet been dispatched.
A vertical line indicates the current time (time now line).
You can adjust the capacity planning table to your precise needs in Customizing. You can make the following settings, among others:
- Scale and heading of time axis
- Number, height and title of charts
- Definition of descriptive fields shown in the table section
- Sorting within a chart
- Specification of which field contents are displayed in which color and shape in the diagram section
- Definition of the time window for automatic/manual dispatching/rescheduling of requirements (planning period) as well as the pre-evaluation period (time between the start of the evaluation period and the start of the planning period) and the post-evaluation period (time between the end of the planning period and the end of the evaluation period).