
 Events
The statistical forecast allows you to make projections on the basis of historical data. For more information, see Planning Table: the Forecast.
In addition, SOP comes with a function that allows you to predict the impact of events whose influence on your logistics plans cannot be derived from historical patterns. For example, you can record the following situations as events:
- Changes in price such as promotions
- Special deals with major customers
- Special deals with vendors
- Management overrides
- Delivery problems of a competitor
- Market intelligence
A typical event curve is shown in the figure below:
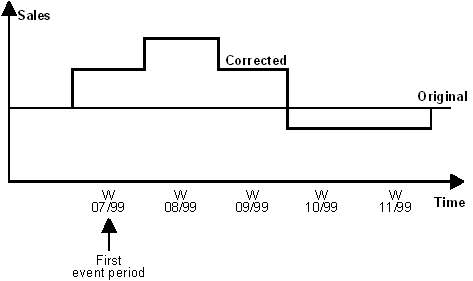
The corrected sales curve represents the effect of a promotion. Sales figures increase during week 1 (07/99) and climb further in week 2 (08/99) as word of the promotion spreads. In week 3 (09/99), sales are still up on the original prediction. In weeks 4 (10/99) and 5 (11/99), there is a drop in sales since market demand is temporarily satisfied. By week 6 (12/99), the impact of the promotion has become negligible.